
IMPERIAL GOLF ESTATES 2025 Sales by Community
To see all the properties, by Community, which sold in 2025 click HERE (more…)
FORT MYERS BEACH 2025 Sales by Community
To see all the properties, by Community, which sold in 2025 click HERE
My Year End Report with full details of Median Sales Prices, Price Per Sq.Ft. and DOM will be published shortly. (more…)
ISLAND WALK 2025 Sales by Community
To see all the properties, by Community, which sold in 2025 click HERE
My Year End Report with full details of Median Sales Prices, Price Per Sq.Ft. and DOM will be published shortly. (more…)
BONITA BAY 2025 Sales by Community
To see all the properties, by Community, which sold in 2025 click HERE
My Year End Report with full details of Median Sales Prices, Price Per Sq.Ft. and DOM will be published shortly. (more…)
BAY FOREST 2025 Sales by Community
To see all the properties, by Community, which sold in 2025 click HERE
My Year End Report with full details of Median Sales Prices, Price Per Sq.Ft. and DOM will be published shortly. (more…)
PELICAN MARSH 2025 Sales by Community
To see all the properties, by Community, which sold in 2025 click HERE
My Year End Report with full details of Median Sales Prices, Price Per Sq.Ft. and DOM will be published shortly. (more…)
How’s the market in February 2025?
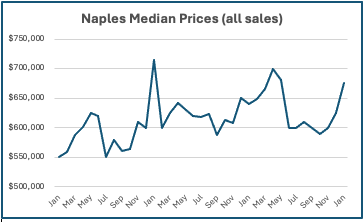
This table shows median prices for all types of property sold in Naples month by month since 2020. There are a couple of outliers, but in general median prices have been in the $600-650,000 range. January 2025 was a little higher at $675,000.
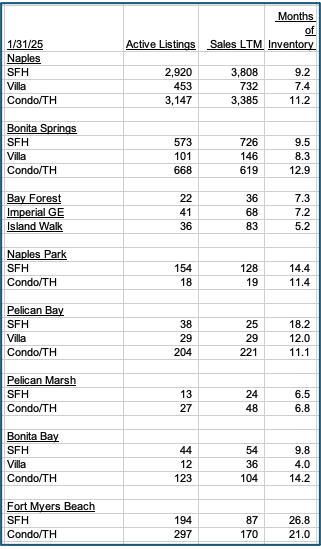
This table shows Active Listings divided by Sales in the last 12 months. The Months of Inventory number means how long it would take to sell the current inventory based upon the rate of sales in the previous year.Generally ,in real estate, 6 months of supply is regarded as a market in equilibrium between buyers and sellers: a higher number favours buyers, a lower number sellers.
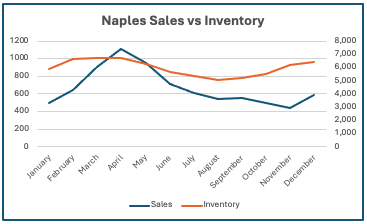
Southwest Florida is, of course, a seasonal market. The following chart shows that sales – which typically occur 6-8 weeks after a contract is signed – are at their highest in March-May, and lowest in October – January. Which makes sense. Inventory is highest in the early months, drops in the summer, and then picks up as we get towards the next season.
Comment
Anecdotal stories are intriguing, but often very selective. I try to present the actual numbers as a basis for making informed decisions by both sellers and buyers.

Andrew.Oliver@Compass.com