
What drives Mortgage Rates in one chart
I can explain as often as I do that the 30-year Fixed rate Mortgage (FRM) is based upon the yield on the US 10-year Treasury (10T), not the Federal Reserve’s Fed Funds rate (FFR), but still I read regularly comments such as “mortgage rates will move up after the Fed increased its interest rate.”
Look at this chart for the last few months, the dates being those when the Federal Reserve increased its interest rate:
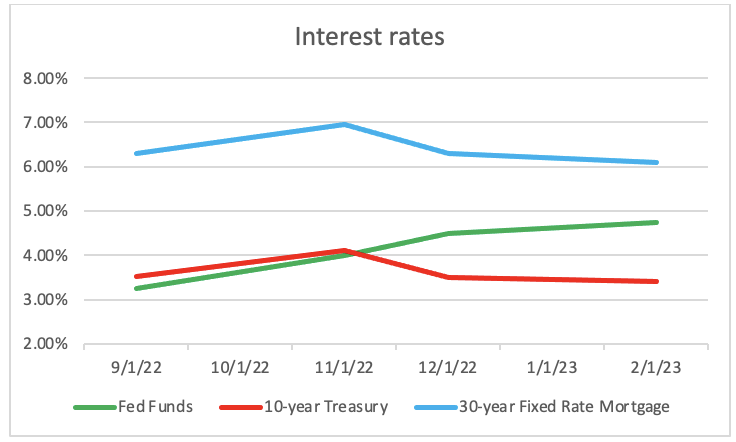
Note the correlation between the 10T (red line) and FRM (blue) – and the lack of correlation between FFR and FRM.
Let’s look at this another way, the spread (difference) between the FRM and 10T and between FRM and FFR:
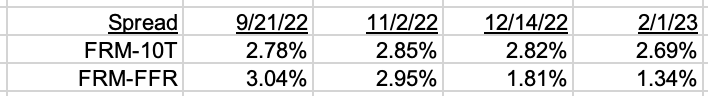
Over the last 5 months, the spread between FRM and 10T has been in a tight band between 2.69% and 2.85%, while that between FRM and FFR has dropped by a huge 1.7%.
For a more detailed explanation of what drives mortgage rates – and why the FRM will fall at some point – read Why Mortgage Rates Will Fall
And read these recent articles:
Lies, Damned Lies and Inflation “Statistics”*
HOW AND WHEN WILL HOUSING REBOUND?
Why Mortgage rates Will Fall
Buyers Undeterred in Ian’s Hardest-Hit Areas
Home Prices After Ian? Probably Going Up
How have home prices behaved after previous major Hurricanes?
How to protect your house from title fraud
Expansion Plans for Fort Myers Airport
Guide to Buying and Selling in Southwest Florida
Market Summaries
The story in 2022 was that prices continued to rise, while sale dropped sharply
Bonita Springs 2022 Housing Market Report
Florida Market Update in 4 minutes
Sales Resemble Pre-Pandemic — But Not Pricing & Inventory
- Andrew Oliver, M.B.E., M.B.A.
Real Estate Advisor
Andrew.Oliver@Compass.com
m 617.834.8205
[…] and Economic commentary Why Mortgage rates Will Fall What drives Mortgage Rates in one chart Lies, Damned Lies and Inflation […]
[…] and Economic commentary Why Mortgage rates Will Fall What drives Mortgage Rates in one chart Lies, Damned Lies and Inflation […]
[…] and Economic commentary Why Mortgage rates Will Fall What drives Mortgage Rates in one chart Lies, Damned Lies and Inflation […]
[…] and Economic commentary Why Mortgage rates Will Fall What drives Mortgage Rates in one chart Lies, Damned Lies and Inflation […]
[…] and Economic commentary Why Mortgage rates Will Fall What drives Mortgage Rates in one chart Lies, Damned Lies and Inflation […]
[…] read these articles: What drives Mortgage Rates in one chart Lies, Damned Lies and Inflation “Statistics”* HOW AND WHEN WILL HOUSING REBOUND? Why […]
[…] read these articles: What drives Mortgage Rates in one chart Lies, Damned Lies and Inflation “Statistics”* HOW AND WHEN WILL HOUSING REBOUND? Why […]
[…] read these articles: What drives Mortgage Rates in one chart Lies, Damned Lies and Inflation “Statistics”* HOW AND WHEN WILL HOUSING REBOUND? Why […]
[…] read these articles: What drives Mortgage Rates in one chart Lies, Damned Lies and Inflation “Statistics”* HOW AND WHEN WILL HOUSING REBOUND? Why […]
[…] read these articles: Naples a top city for corporate headquarters post-pandemic What drives Mortgage Rates in one chart Lies, Damned Lies and Inflation “Statistics”* HOW AND WHEN WILL HOUSING REBOUND? Why […]
[…] read these articles: What drives Mortgage Rates in one chart Lies, Damned Lies and Inflation “Statistics”* HOW AND WHEN WILL HOUSING REBOUND? Why […]