
PELICAN MARSH 2023 MARKET REPORT and 5-YEAR REVIEW
This report analyses the Median Price and Sales per quarter since 2019, along with the Sales by Price point, Price per Sq.Ft., and the Days properties were on the market before receiving an offer (DTO). Median numbers are used in all calculations.
Click PELICAN MARSH 2023 MARKET REPORT and 5-YEAR REVIEW to download a copy of this report.
If you are thinking of selling, please contact me for a current market analysis for your property. With little supply, and the prospect of lower interest rates in 2024, this could be a good time to sell.
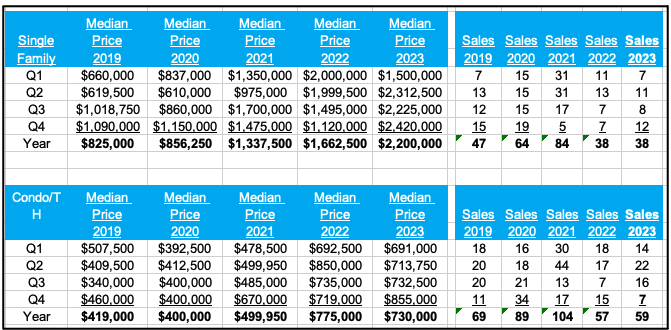
Median Price and Sales
The median price of the Single Family homes sold in Pelican Marsh more than doubled from $825,000 in 2019 to $2.2 million in 2023. Sales surged until around Q3 2021, thereafter returning to pre-pandemic levels and below.
The median price of the Condos sold increased by 74% from $419,000 in 2019 to $775,000 in 2022, before easing to $730,000 in 2023. Sales following a similar pattern to that for SFs.
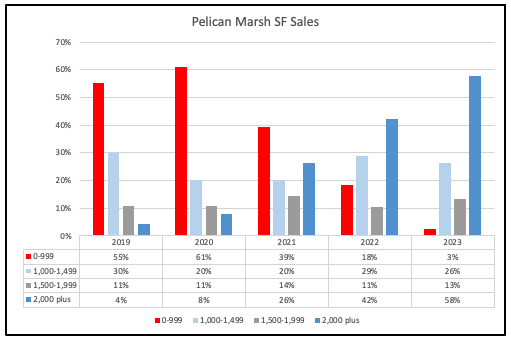
Single Family Sales by Price
Another way to look at sales is the distribution by price. In 2019, 55% of Single Family sales were under $1 million and by 2023 that had dropped to just 3%. Conversely, the share of sales over $2 million went from 4% to 58% in the same period.
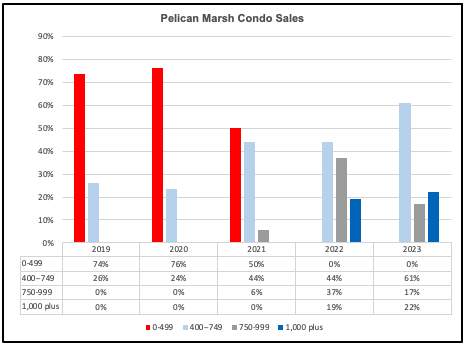
Condo Sales by Price
TThe shift in the breakdown of Condo sales was even more dramatic. In 2019, 74% of all sales were under $500,000 and that dropped to zero in 2022/23. By contrast, there were no sales over $1 million in 2019,2020 or 2021, but 22% of the total exceeded that figure in 2023.
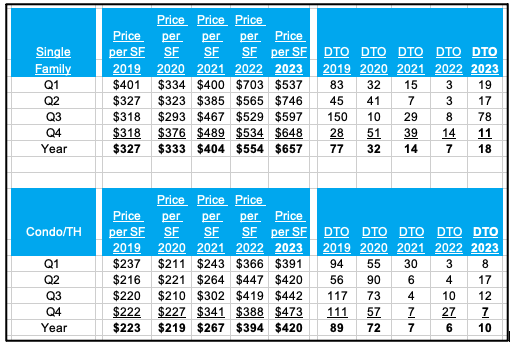
Price per Sq Ft (PSF) and Speed of Sales (Days to Offer Accepted – DTO)
PSF is another way to look at sales. For SFs the PSF doubled from $327 in 2019 to $657 in 2023; for Condos the increase was 88% from $223 to $420.
There was also a dramatic increase in the speed of sales, with the median DTO plummeting from 77 in 2019 down to just 7 in 2022 for SFs, and from 89 to 6 for Condos. The pace of sales has slowed somewhat since Q3 2022, but it remains far above the earlier levels.
Sales have been taking longer since Q3 2022, but they are still taking place more quickly than in the pre-pandemic years
INVENTORY
A market is generally deemed to be in equilibrium between buyers and sellers when there is 6 months of supply. Currently, Pelican Marsh has much less supply, a situation that traditionally favours sellers.
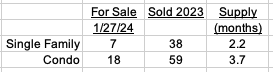
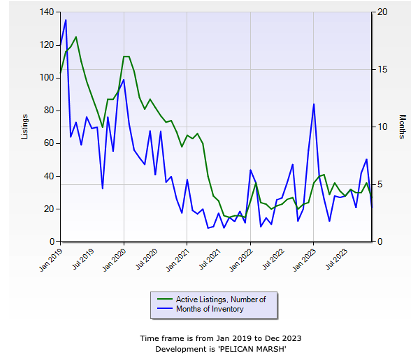
The following chart shows that, unlike Naples generally, inventory (green line) has not recovered from the extremely low levels of late 2021. The number of months of inventory (how many months it would take to sell the current inventory – blue line) has followed a similar pattern.
LONGER TERM VIEW
John Donne wrote:
“No man is an island,
Entire of itself,
Every man is a piece of the continent,
A part of the main.”
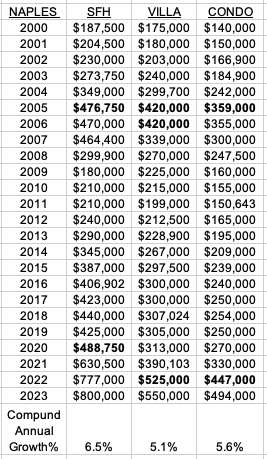
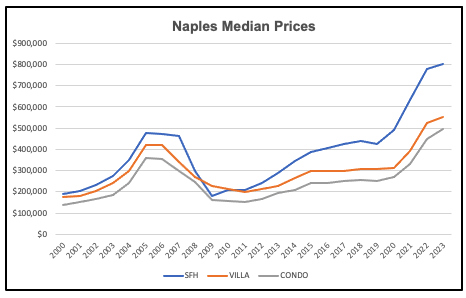
In like vein, communities like Pelican Marsh are part of the “main” – Naples. The chart and table below are, therefore, for Naples and show median prices since 2000.The median price did not exceed the 2005/06 peaks until 2020 for SFs and until 2022 for Villas and Condos. While the market conditions are vastly different from the earlier period, the slope of the increases from 2001-2005 and 2019-2022 is eerily similar. Over the whole of this century, the compound growth rate has been 6.5% for SFs, 5.1% for Villas and 5.6% for Condos. Unfortunately, the price appreciation has come in violent bursts rather than steady annual increases.
COMMENT
The numbers have been dramatic over the last few years, for all the well-known reasons. With the market returning to more normal conditions, pricing and condition are again important. If you are thinking of selling, please contact me for a current market analysis for your property.